 digest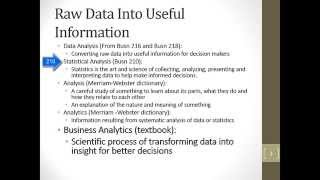
Short Summary
Main recommendation: Treat business analytics as a scientific process that turns raw data into insight for better, data-driven decisions, and build that skill step by step in Excel. The video frames this as the same core idea as the data analysis and statistics from earlier prerequisite courses, now extended into descriptive, predictive, and prescriptive analytics. It sets up the course's approach and previews that the next video starts with descriptive analytics and what-if models.
Key Points
- Business analytics is defined from the textbook as the "scientific process of transforming data into insight for better decisions."
- The core goal matches earlier data analysis and statistics courses: take raw data and convert it into useful information for decision makers.
- Business analytics has three parts: descriptive (describing the past), predictive (building models to predict the unknown future), and prescriptive (building models to predict the best course of action).
- The "scientific process" in this definition relies on queries, linear regression, and optimization, with optimization being new to this class.
Details Worth Noting
- Concrete instructions: No step-by-step Excel procedures are given in this video; it is an introduction, and the video states that the Excel hands-on work begins in video number two. Actionable setup guidance is limited to the prerequisite statement that this is an advanced Excel course and that prior coursework in Business 210, 216, and 218 is expected.
- Descriptive analytics examples named in the video include data queries (filters in Excel or Access), reports (income statements, regional reports, pivot tables with multiple criteria), descriptive statistics (mean, median, mode, standard deviation, correlation), data visualization (charts, tables, conditional formatting), what-if models, and data dashboards.
- Predictive analytics examples include linear regression, time series analysis and forecasting, and data mining (which this course will not cover).
- Prescriptive analytics examples include optimization, simulation (using native Excel functions), and decision analysis (which this course will not cover, though briefly touched on in Business 210).
- The video says a what-if model is built with assumptions or formula inputs that can be changed so that everything updates automatically.
Bottom Line
This video is an orientation that establishes business analytics as data-driven decision making, organized into descriptive, predictive, and prescriptive stages, with the hands-on Excel modeling beginning in the next video.


