 digest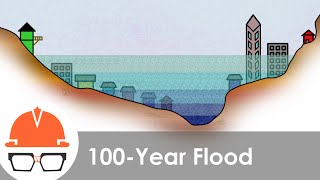
Short Summary
Main recommendation: Do not read the "100-year flood" as a once-a-century schedule; it means a flood with a 1% annual exceedance probability, a flow magnitude that has a 1% chance of occurring or being exceeded in any given year. The video explains how this statistic is derived from stream gage and rainfall data and how it defines the FEMA floodplain used for insurance and development decisions.
Key Points
- The 1960s National Flood Insurance Program was created because development near rivers and creeks was increasing flood risk, and the 100-year flood line was chosen as the societal threshold for mandatory insurance.
- Return period is misleading because it implies cyclical timing; a 100-year flood that occurred last year still has a 1% chance of recurring this year, so some hydrologists now use annual exceedance probability instead.
- Stream gages (for example, USGS gages that measure depth via air pressure and convert it to flow) allow engineers to fit annual peak flows to a probability distribution, estimating rare floods even with short records, such as the roughly 25 years of data he has for the Williamson Creek gage near his house.
- Where no stream gage exists, the rational method converts rainfall intensity into peak flow, but it is approximate, relying on a single runoff coefficient (C) that lumps together vegetation, slope, soil, and impervious cover.
- Complex watersheds require full hydrologic models with design storms, runoff calculation, and routing through channels and reservoirs, computed in time steps that can be as short as a minute.
Details Worth Noting
- Concrete instructions: No step-by-step instructions were given. The speaker notes that FEMA floodplain maps and USGS stream gage data are publicly available online.
- The rational method is stated as: peak flow ≈ rainfall intensity × area × C, where C is a single coefficient for the watershed; the imperial units conversion factor is about one, so it is typically dropped.
- The height example illustrates the statistics: average height and standard deviation fit a normal distribution, letting you estimate the share of a population above a height (such as 7 feet) that is absent from your sample.
- The speaker notes that engineering hydrology is not exact; results are not taken to the fifth decimal place, and infrastructure gets "one chance to get the answer right."
Bottom Line
The 100-year flood is a statistical threshold for a 1% yearly chance of a given flow, not a predictable cycle, and the floodplain maps built from it reflect a chosen level of tolerable risk.


