 digest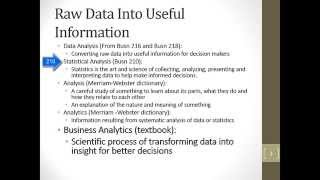
Welcome to Highline Class BI 348, video number one. This class is about the basics of business analytics using Excel, and in this video, we're just going to look at the definition of business analytics. And then we'll get busy in video number two using Excel to do business analytics.
Slide number three. Hey, we want to remind ourselves there's a bunch of prerequisites for this class. We did a lot of data analysis in Business 216 and Business 218. This is a computer class, this is a straight advanced Excel class. And in statistical analysis, Business 210 — those were all the prerequisites. And guess what? The definition of data analysis in Business 216 and 218 is right here. And it's pretty close to the definition we're going to use for our BI class.
Now, definition of data analysis: converting raw data into useful information for decision makers. Now in these two classes, we just learned how to use the computer programs. In Business 210, we use statistical methods. And our definition there of statistics, which is really a definition of a type of data analysis, we defined it as: statistics is the art and science of collecting, analyzing, presenting and interpreting raw data to make informed decisions. Notice the essence is the same here. We have some raw data, and we're converting it into useful information for decision makers. In 210, we used basic descriptive statistics, probability, probability distributions, hypothesis testing, and other methods.
Hey, here is our definition for this class. Business analytics, straight from the textbook: scientific process of transforming data into insight for better decisions. So the base definition of data analysis is still the same. We have some data and we need to convert it into information to make decisions.
Now let's go to our next slide, slide four. There's the definition, straight from our textbooks. Other ways of describing what we're going to do: data driven decision making, fact-based decision making. And the scientific process just means we're going to be using queries, linear regression, and optimization. Now in our Business 216 and 218, we did queries to extract useful data from our raw data. In Business 210, we did basic linear regression. In this class, we'll get to learn more about linear regression. And then optimization is something specific to this class that we have not done so far.
Now, business analytics has three parts. Descriptive statistics, that's just describing the past. Predictive analytics, building models that help us predict the unknown future. And prescriptive statistics, which build models that help predict the best course of action.
Next slide. Descriptive analytics, here are some examples. Data queries like a filter in Excel or Access. We did those in Business 216 and 218. Reports like an income statement, or regional report, or a pivot table with multiple criteria. We did that in all of the prerequisite classes. Descriptive statistics: mean, median, mode, standard deviation, correlation. We did those in 210, and we'll have a review of that in this class. Data visualization. We did that in all the pre-req classes. Charts, tables, conditional formatting. What-if models. We did that in all of the prerequisite classes. That just means a what-if model: we build our model with some assumptions or formula inputs. We'd change the formula inputs and then everything updates. And data dashboards. We have not done that in the pre-req class. But that just is one where we collect together items, such as tables, charts, descriptive statistics, that will update as new data arrives.
Next slide, predictive analytics. Some examples: linear regression. We did a little bit of that in Business 210. We'll get to do a lot more of that here. We'll do time series analysis and forecasting. And a topic that is part of predictive analytics that we will not get to is data mining.
Next slide, prescriptive analytics. Examples: optimization, simulation, and decision analysis. Now optimization, we'll get to do some basic optimization models in this class. Some basic simulation using native Excel functions. And decision analysis, which we will not cover in this class, although we did do a little bit of this in Business 210.
Now, let's go back to slide number four. Business analytics: descriptive, predictive, prescriptive. Next video, video number two, will start with descriptive analytics, where we build what-if models. And we'll talk about how to build good spreadsheet models. All right, we'll see you next video.